


What is 7QC tools Certification?
Quality improvement process starts with knowing or identifying what and where the real problem is. The organization must know where they stand, what is the problem and the root cause of respective problem before recommending any solution for the improvement. Hence, locating and eliminating the root cause of the problem is one of the crucial parts of improvements. The 7 QC tools are most basic and easy to understand but most widely used for improvements and the 7QC tools training are imperative in the growth of a company.
The title—7QC—is given so because it provides a set of graphical techniques that are identified as most helpful in troubleshooting the existing issues. These are the fundamental instruments to improve quality and process. They are used systematically to understand and identify the risk, asses it, control fluctuations of product quality, and accordingly provide solutions to avoid future defects.
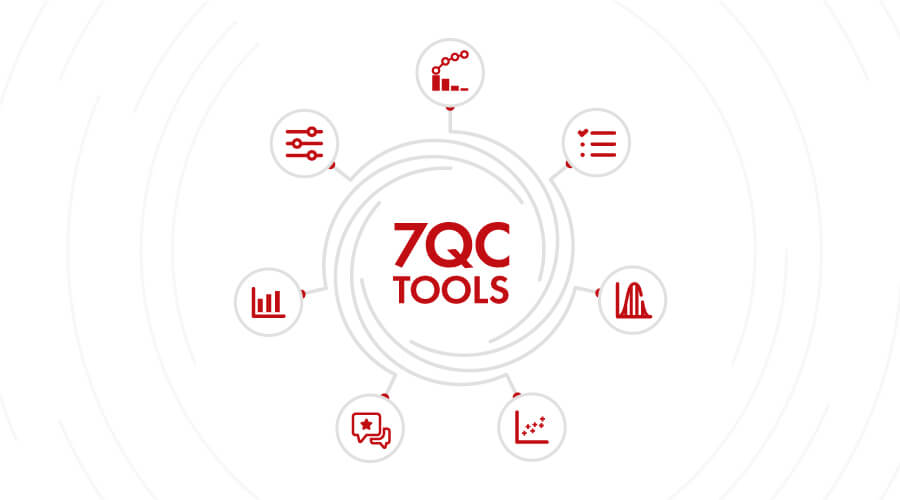
7 QC Tools

Cause-and-effect diagram
also called Ishikawa or fishbone chart): Also called fishbone training, it Identifies many possible causes for an effect or problem and sorts ideas into useful categories.

Check sheet
A structured, prepared form for collecting and analyzing data; a generic tool that can be adapted for a wide variety of purposes.

Control charts
Graphs used to study how a process changes over time. Comparing current data to historical control limits leads to conclusions about whether the process variation is consistent (in control) or is unpredictable (out of control, affected by special causes of variation).

Histogram
The most commonly used graph for showing frequency distributions, or how often each different value in a set of data occurs.

Pareto chart
Shows on a bar graph which factors are more significant.

Scatter diagram
Graphs pairs of numerical data, one variable on each axis, to look for a relationship.

Stratification
A technique that separates data gathered from a variety of sources so that patterns can be seen (some lists replace “stratification” with “flowchart” or “run chart”).

7QC Tools Certification clients


Our Insightful Knowledge
7 QC Tools for Quality Improvement with a Strategic Plan
3rd May, 2025
Empower your business with 4C
- Our highly qualified team will provide 7QC tools training that encompasses an in-depth knowledge about concepts and critical foundational of all the 7 QC Tools.
- The 7QC tools training will also teach employees to structure those QC Tools accurately & fast using a spreadsheet.
- From Fishbone training to effectively creating run charts and analysing them to improve internal efficiency and productivity, 4C provides comprehensive training.
- Our team can help your organization in identifying the problem and their relevant root causes with the help of 7QC tools training program to promote quality control and improvement culture in the organization.