

Table of Contents
- What Are the Old 7 QC Tools?
- What Are the New 7 QC Tools?
- New 7 QC Tools vs Old 7 QC Tools: Key Differences
- When Should You Use the New 7 QC Tools?
- Can You Use the New and Old 7 QC Tools Together?
- Common Mistakes When Applying the New 7 QC Tools
- How 4C Consulting Can Help Your Organization Apply Quality Improvement Tools
- Frequently Asked Questions
New 7 QC Tools vs Old 7 QC Tools: Key Differences and Applications
13th Nov, 2026
Quality problems do not always begin with a measurable defect. Sometimes, the challenge is an unclear objective, conflicting departmental priorities, an incomplete implementation plan or a risk that nobody anticipated.
Traditional quality control tools help teams analyse data, identify patterns and monitor process performance. However, when a problem involves multiple stakeholders, complex relationships or future planning, teams may need a different approach.
This is where the new 7 QC tools, also known as the seven management and planning tools, become useful. Understanding the difference between the new 7 QC tools and the old 7 QC tools helps organizations select the right method for analysing problems, planning improvements and managing quality initiatives.
What Are the Old 7 QC Tools?
The old 7 QC tools are traditional quality control methods used to collect data, examine variation, investigate defects and monitor process performance.
The seven tools covered in our guide to the 7 QC tools with examples are:
- Check Sheet
- Histogram
- Pareto Chart
- Cause-and-Effect Diagram
- Scatter Diagram
- Control Chart
- Stratification
These tools are particularly useful when teams have measurable information to analyse. For example, a manufacturer can use quality data to determine which defects occur most frequently or monitor whether a production process remains stable over time.
However, when a team must organize a large volume of ideas, map relationships between departments or plan activities before implementation, the new 7 QC tools can provide a more suitable framework.
What Are the New 7 QC Tools?
The new 7 QC tools are management and planning methods that help teams structure ideas, understand complex relationships, translate objectives into actions and anticipate implementation challenges.
Unlike traditional tools that often focus on numerical data and process performance, these tools can work with qualitative information, logical relationships and planning decisions. Some also incorporate numerical analysis.
Here is how each tool supports practical business and quality management activities.
1. Affinity Diagram
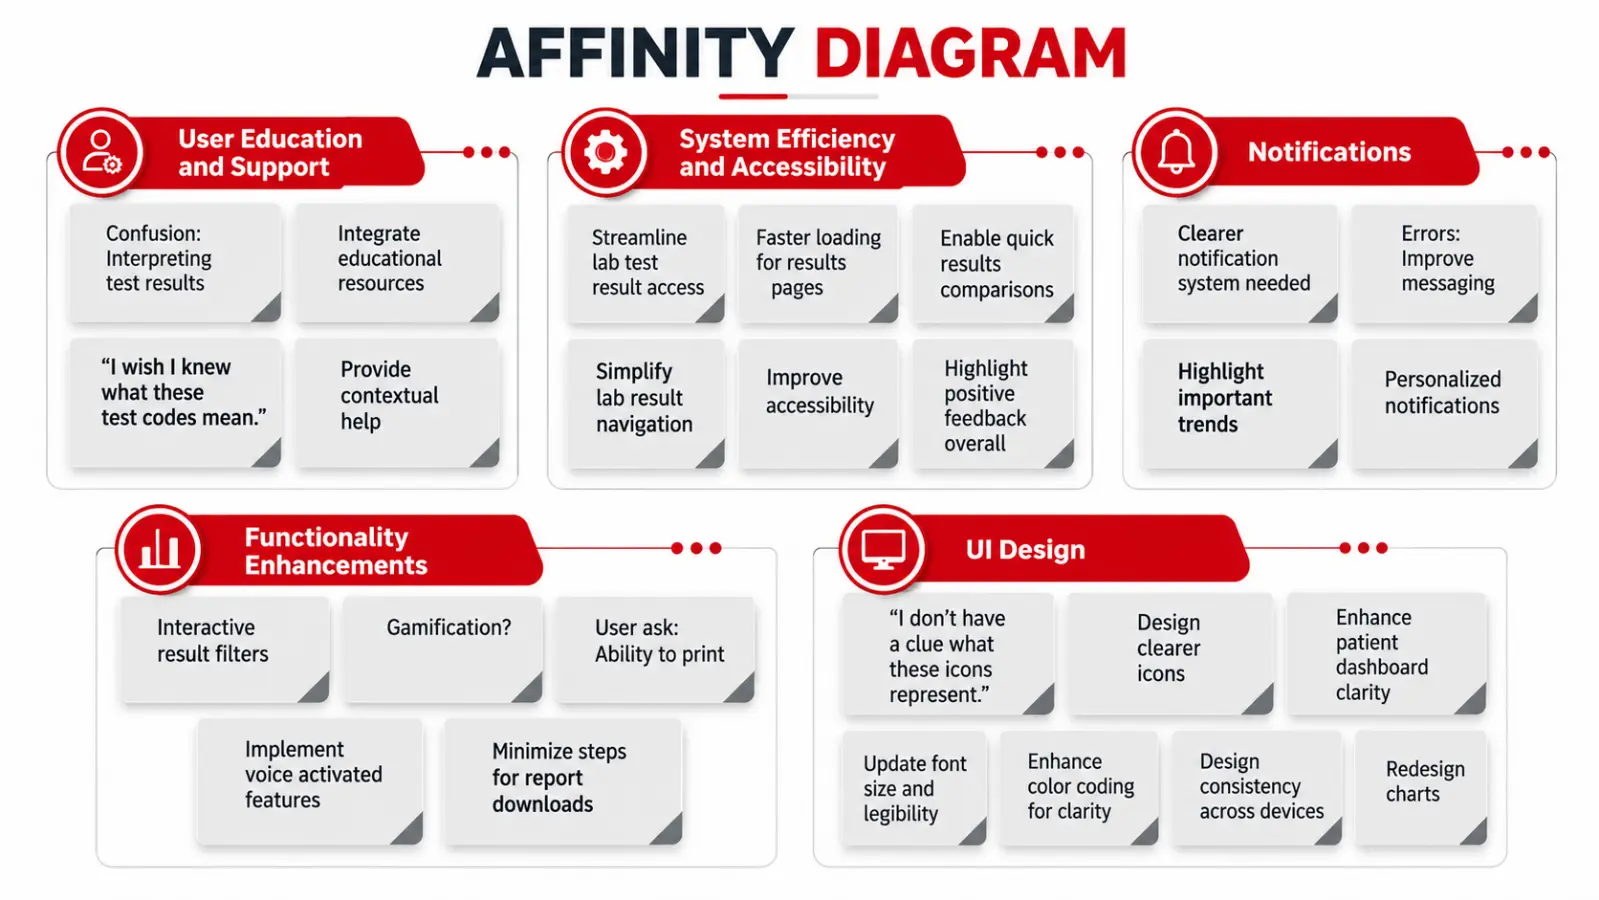
An Affinity Diagram organizes a large number of ideas, observations or opinions into groups based on their natural relationships. It helps teams identify common themes without deciding too early which ideas are most important. This tool is useful when information comes from several sources and the underlying patterns are not immediately clear.
When to use an Affinity Diagram:
- Organizing feedback from employees, customers or suppliers.
- Grouping observations collected during quality improvement workshops.
- Identifying recurring themes in customer complaints.
- Structuring ideas before developing an improvement plan.
Example: A manufacturing company collects feedback from production employees about recurring operational difficulties. Responses mention machine setup delays, unclear work instructions, material shortages and inspection bottlenecks. The team groups related observations into categories such as equipment, methods, materials and inspection. These categories help it identify the main areas requiring further investigation.
Key benefit: An Affinity Diagram turns scattered information into organized themes, giving teams a clearer starting point for problem-solving.
2. Interrelationship Diagram
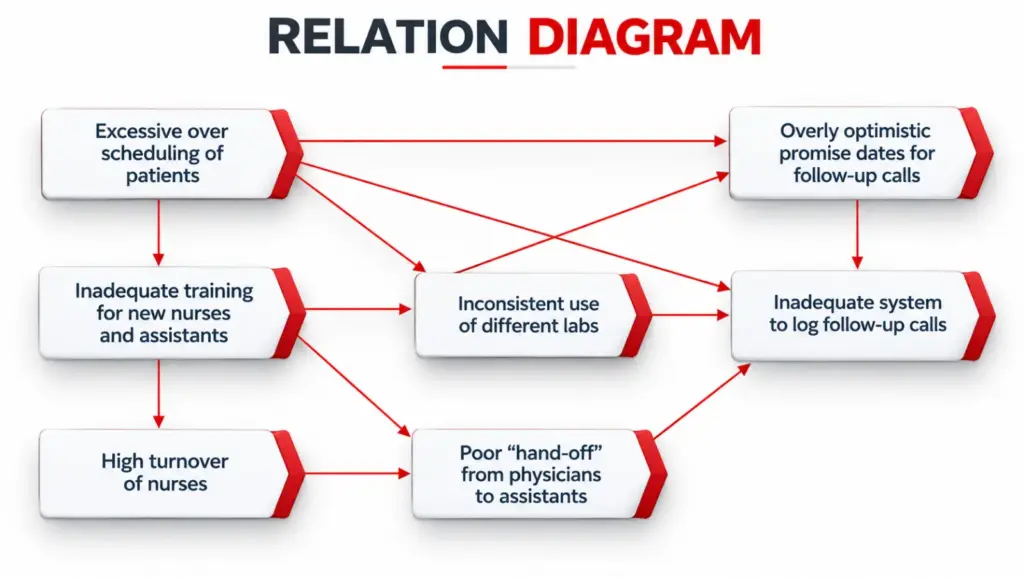
An Interrelationship Diagram, also called a Relations Diagram, helps teams examine how different issues influence one another. It is particularly useful when a problem has several connected factors rather than one obvious cause. The diagram uses arrows to represent relationships between factors. By reviewing the connections, teams can identify issues that appear to influence multiple other problems.
When to use an Interrelationship Diagram:
- Investigating complex, interconnected operational problems.
- Understanding how decisions in one department affect another.
- Exploring relationships between delays, resource constraints and process performance.
- Identifying influential factors that deserve closer investigation.
Example: A company experiences repeated delays in completing customer orders. The team identifies several related issues: inaccurate production schedules, late material availability, frequent priority changes and delayed quality inspections. An Interrelationship Diagram helps the team map how these factors influence one another. It may reveal that inaccurate planning contributes to material shortages and scheduling changes, which then affect inspection and dispatch timelines. The team can investigate these relationships further before deciding where to intervene.
Key benefit: The tool helps teams understand connected problems and avoid treating each symptom as an isolated issue. The relationships shown should still be validated using operational evidence.
3. Tree Diagram
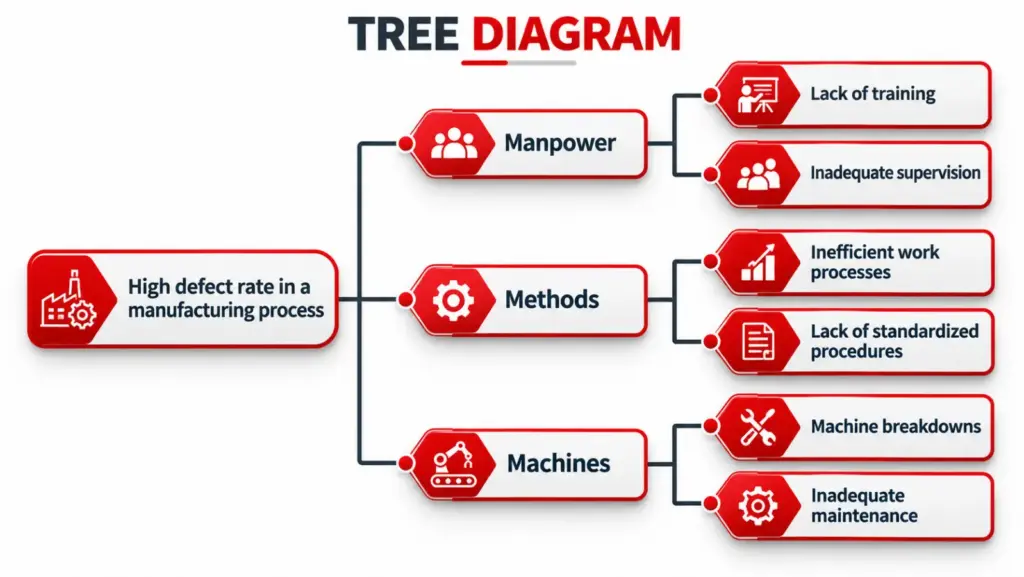
A Tree Diagram breaks a broad objective into smaller objectives, activities and actionable tasks. It helps teams understand what needs to be done to achieve a specific outcome. The diagram starts with a main goal and branches into progressively more detailed requirements. This makes it easier to translate an improvement objective into a structured plan.
When to use a Tree Diagram:
- Breaking quality objectives into measurable activities.
- Planning corrective or improvement initiatives.
- Identifying the tasks required to implement a new process.
- Clarifying responsibilities and resource requirements.
Example: A manufacturer wants to reduce production rework. The quality team breaks this objective into several areas, including operator training, machine maintenance, work instruction updates and in-process inspection. Each area is then divided into specific actions, such as reviewing training records, establishing maintenance schedules, revising instructions and defining inspection checkpoints. The resulting diagram provides a structured basis for assigning responsibilities and monitoring progress.
Key benefit: A Tree Diagram converts broad objectives into manageable actions and helps teams identify what must be completed at each stage.
4. Matrix Diagram
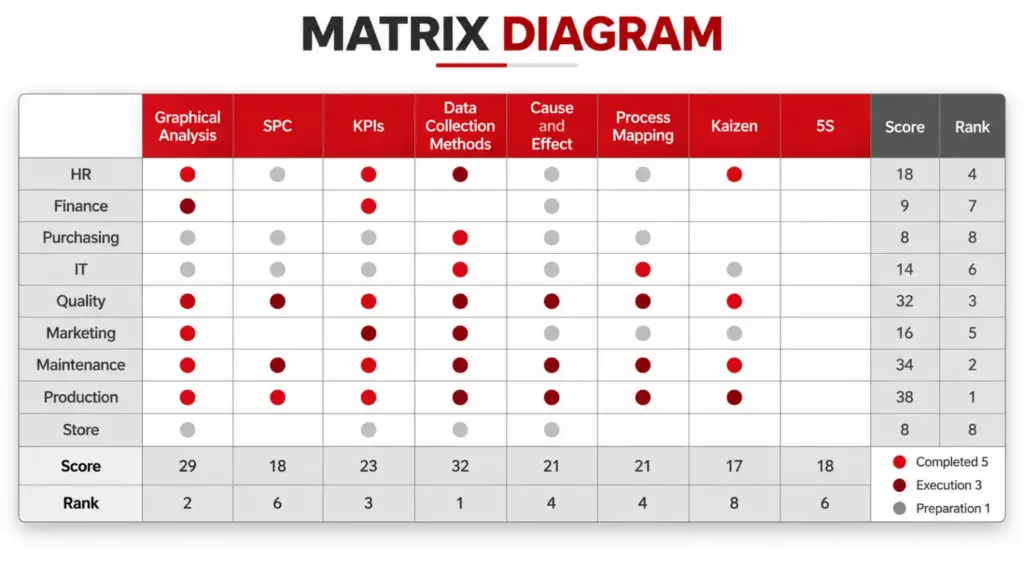
A Matrix Diagram displays relationships between two or more groups of information. It helps teams examine how responsibilities, requirements, objectives, processes or resources relate to one another. Depending on the matrix format, relationships may be represented using symbols, ratings or other agreed indicators.
When to use a Matrix Diagram:
- Mapping responsibilities against departments or roles.
- Comparing customer requirements with product features.
- Connecting quality objectives with performance indicators.
- Reviewing relationships between processes and documented requirements.
- Identifying gaps or overlapping responsibilities.
Example: A company is implementing a revised quality management process. It creates a matrix connecting process activities with the departments responsible for completing them. The matrix reveals that two departments believe the other is responsible for maintaining a particular inspection record. The company can clarify ownership before the gap leads to incomplete documentation.
Key benefit: A Matrix Diagram makes relationships and responsibility gaps easier to identify, supporting clearer coordination and decision-making.
5. Matrix Data Analysis
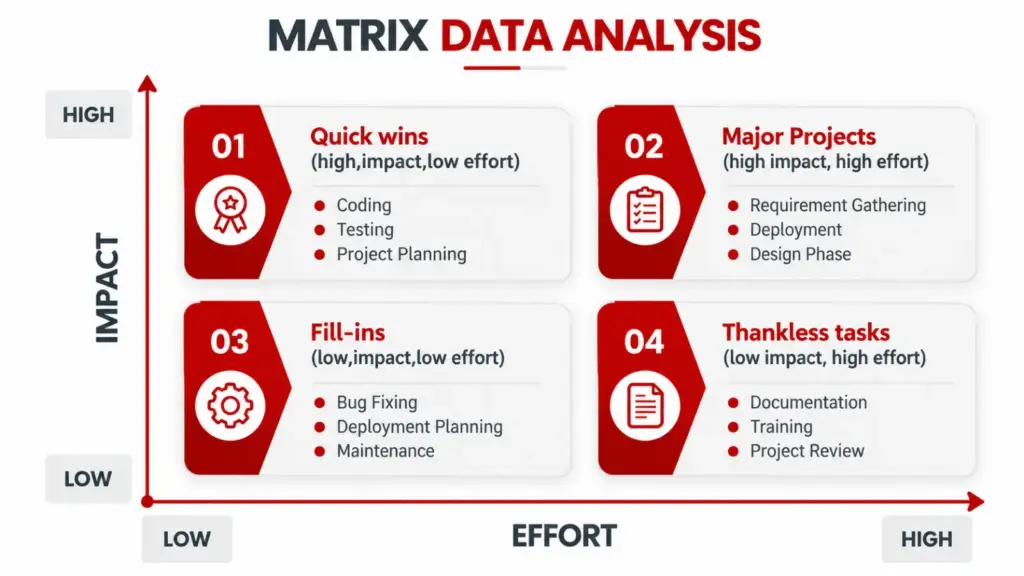
Matrix Data Analysis is the quantitative tool in the new 7 QC toolkit. It uses numerical data and analytical methods to examine complex relationships and support decisions involving several variables. It is particularly useful when a team needs to evaluate multiple factors rather than rely only on opinions or unstructured comparisons. In some quality management frameworks, this tool is associated with principal component analysis.
When to use Matrix Data Analysis:
- Analysing multiple variables in a quality improvement
- Evaluating patterns across complex datasets.
- Supporting decisions when several measurable factors interact.
- Investigating which variables account for important differences in performance.
Example: A manufacturer is investigating variation in the performance of a product. The team has collected measurements relating to material properties, processing conditions and final product characteristics. Appropriate statistical analysis can help the team identify patterns in the data and determine which variables deserve further investigation. The results can guide subsequent testing and process improvement.
Key benefit: Matrix Data Analysis helps teams extract useful information from complex numerical datasets. It requires suitable data and the right analytical expertise.
6. Process Decision Program Chart (PDPC)
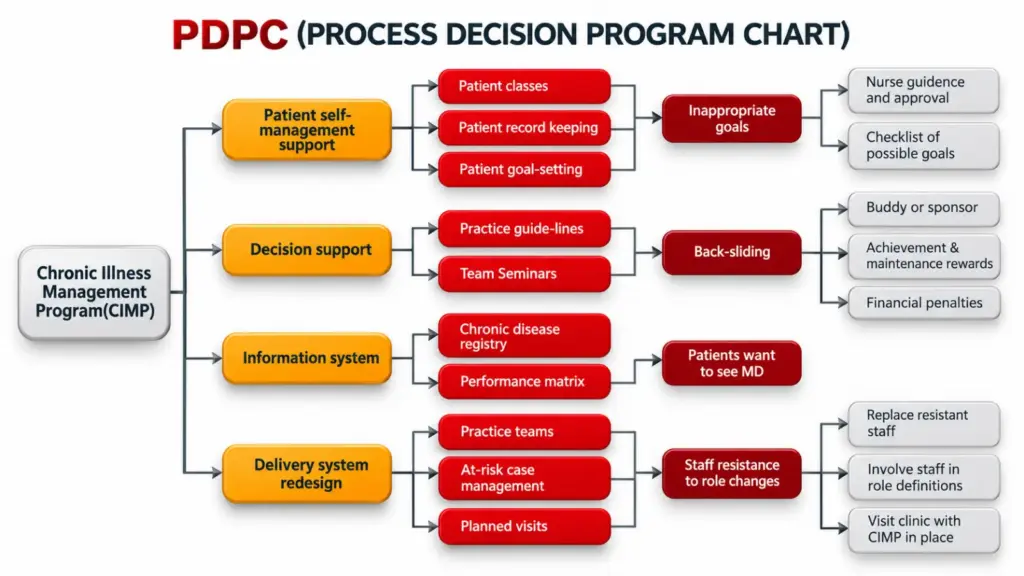
A Process Decision Program Chart (PDPC) helps teams anticipate potential problems during the execution of a plan and identify appropriate countermeasures in advance. Rather than waiting for implementation problems to occur, teams examine important activities, consider what could go wrong and prepare responses.
When to use a PDPC:
- Planning changes to critical operational processes.
- Preparing for certification or major system implementation activities.
- Identifying risks before launching a new product or service.
- Planning projects involving several departments or external dependencies.
- Preparing contingency measures for potential delays or disruptions.
Example: A company plans to introduce a new inspection process across multiple production lines. Before implementation, the team considers possible issues, including equipment unavailability, incomplete employee training, inconsistent inspection records and delays in approving revised procedures. For each significant risk, the team identifies a preventive action or contingency measure. For example, it may arrange backup equipment, schedule training before rollout and establish a review process for inspection records.
Key benefit: PDPC encourages preventive thinking and helps organizations prepare for foreseeable implementation challenges.
7. Arrow Diagram
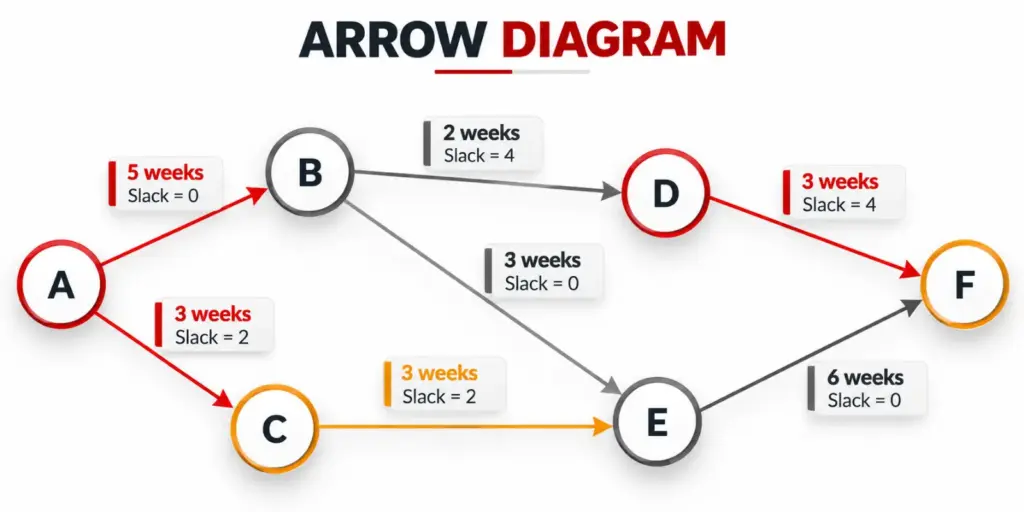
An Arrow Diagram, also called an Activity Network Diagram, represents the sequence and dependencies of activities in a project. It helps teams understand which tasks must be completed before others can begin and which activities can proceed simultaneously. It is particularly valuable when the timing of one activity affects the progress of several others.
When to use an Arrow Diagram:
- Planning quality improvement projects.
- Coordinating activities across departments.
- Scheduling equipment installation or process changes.
- Identifying task dependencies and potential bottlenecks.
- Reviewing the critical path of a project.
Example: A manufacturer plans to introduce a new production line. The project involves equipment procurement, site preparation, installation, employee training, trial production and final approval. An Arrow Diagram maps the required sequence and dependencies. The team can identify which activities may run in parallel and which delays could affect the planned launch date.
Key benefit: An Arrow Diagram supports realistic scheduling, resource coordination and better visibility of activities that may delay project completion.
New 7 QC Tools vs Old 7 QC Tools: Key Differences
Both sets support quality improvement but they address different aspects of problem-solving. Traditional tools are particularly effective for analysing measurable quality problems, while the new tools help teams organize complex information and plan coordinated action.
| Comparison factor | Old 7 QC tools | New 7 QC tools |
|---|---|---|
| Primary purpose | Analyse quality data and monitor process performance | Structure ideas, relationships, plans and decisions |
| Typical information | Defect counts, measurements, frequencies and process observations | Ideas, objectives, dependencies, risks, relationships and selected numerical data |
| Main focus | Understanding and controlling existing quality problems | Planning improvements and managing complex situations |
| Common applications | Defect analysis, variation monitoring and process investigation | Project planning, risk anticipation, responsibility mapping and strategic problem-solving |
| Typical outputs | Charts, distributions, trends and structured defect records | Idea groups, relationship maps, action breakdowns, matrices, risk responses and activity networks |
| Best suited for | Problems that can be examined through quality data | Problems requiring structured thinking, coordination and forward planning |
The distinction is not absolute. Traditional tools can support planning and the new tools can contribute to analysing existing problems. The right choice depends on the question the team needs to answer.
When Should You Use the New 7 QC Tools?
The new 7 QC tools are especially useful when a quality challenge cannot be addressed through numerical analysis alone.
Consider using them when your organization needs to:
- Organize complex information: Use an Affinity Diagram to group ideas and observations into meaningful themes.
- Understand interconnected problems: Use an Interrelationship Diagram to examine how different factors influence one another.
- Translate objectives into actions: Use a Tree Diagram to break a broad goal into specific activities.
- Clarify roles and relationships: Use a Matrix Diagram to map responsibilities, requirements or process relationships.
- Analyse complex numerical data: Use Matrix Data Analysis when appropriate statistical methods are needed.
- Anticipate implementation risks: Use PDPC to identify possible obstacles and prepare countermeasures.
- Coordinate project activities: Use an Arrow Diagram to map dependencies and scheduling requirements.
The key is to select the tool based on the nature of the problem, not simply because it is part of the seven-tool framework.
Can You Use the New and Old 7 QC Tools Together?
Yes. In many situations, using both sets creates a more complete quality improvement approach. The traditional tools help teams investigate performance and analyse quality data, while the new tools support planning, coordination and implementation.
For example, consider a manufacturer experiencing repeated product rejection.
Step 1: Understand the problem. The team uses traditional QC tools, such as a Check Sheet and Pareto Chart, to organize defect data and identify the most significant rejection categories.
Step 2: Investigate possible causes. A Cause-and-Effect Diagram helps organize potential causes for further verification.
Step 3: Structure the improvement plan. An Affinity Diagram can organize ideas gathered from employees, while a Tree Diagram can break the selected improvement objective into actionable tasks.
Step 4: Anticipate risks. A PDPC helps the team identify potential implementation problems and prepare suitable responses.
Step 5: Coordinate activities. An Arrow Diagram helps schedule the improvement activities and identify dependencies.
Step 6: Monitor the results. After implementation, appropriate traditional tools, such as a Control Chart, can help assess process behaviour over time.
This approach connects problem analysis with planning and follow-through. The specific tools should be selected according to the problem, available evidence and the organization’s improvement objectives.
Common Mistakes When Applying the New 7 QC Tools
Although the new 7 QC tools support structured thinking, their effectiveness depends on how teams use them. Common mistakes include:
- Choosing a tool before defining the problem: Start with a clear objective so the team knows what the analysis must achieve.
- Treating assumptions as confirmed facts: Validate important relationships and proposed causes using evidence wherever possible.
- Creating diagrams without assigning actions: Translate findings into responsibilities, deadlines and follow-up activities.
- Ignoring employee input: Involve relevant people who understand the process and its practical constraints.
- Overcomplicating the analysis: Include the information needed for a decision without adding unnecessary detail.
- Failing to review implementation: Check whether planned actions were completed and whether they achieved the intended result.
The purpose of these tools is not simply to create diagrams. It is to improve the quality of decisions and make problem-solving more systematic.
How 4C Consulting Can Help Your Organization Apply Quality Improvement Tools
4C Consulting supports organizations through operational excellence consulting, Lean and Six Sigma initiatives, quality improvement guidance and professional training. Our consultants help businesses identify improvement opportunities, structure problem-solving activities and strengthen their approach to process performance.
Whether your organization is planning a process change, addressing recurring operational challenges or developing employee capability, the right guidance can help translate quality tools into practical improvements.
Looking to strengthen your organization’s quality improvement approach?
Connect with 4C Consulting to discuss your process improvement and quality management requirements.
Frequently Asked Questions
1. Are the new 7 QC tools better than the old 7 QC tools?
Neither set is universally better. Traditional tools are effective for analysing measurable quality problems and monitoring process performance, while the new tools are useful for structuring complex ideas, planning activities and managing relationships or risks. The choice depends on the problem.
2. What are the seven management and planning tools?
The seven management and planning tools are the Affinity Diagram, Interrelationship Diagram, Tree Diagram, Matrix Diagram, Matrix Data Analysis, Process Decision Program Chart (PDPC) and Arrow Diagram.
3. Which new QC tool is most useful for risk planning?
The Process Decision Program Chart (PDPC) is particularly useful for risk planning because it helps teams anticipate potential problems during implementation and prepare preventive or corrective responses.
4. Which new QC tool helps identify task dependencies?
The Arrow Diagram maps activity sequences and dependencies. It helps teams understand which tasks must happen first, which activities can run in parallel and which delays may affect the project schedule.
5. Can small and medium-sized businesses use the new 7 QC tools?
Yes. Small and medium-sized businesses can use these tools to organize employee feedback, clarify responsibilities, plan improvements, anticipate risks and coordinate activities. The tools can be adapted to the complexity of the problem and the resources available.
6. Do employees need training to use the new 7 QC tools?
Basic tools can be introduced through practical workshops and guided exercises. More complex applications, particularly Matrix Data Analysis, may require additional analytical knowledge. Training should match employees’ roles and the organization’s improvement objectives.

Devanshi Viramgami
Vice PresidentDevanshi is a Vice President at 4C Consulting with expertise in 5S, Lean, and Six Sigma. She helps organizations improve workplace organization, streamline processes, reduce operational waste, and build a culture of continual improvement. Her expertise in Lean methodologies and process improvement supports businesses in enhancing efficiency, strengthening operational discipline, and achieving sustainable performance improvements.